
▸ Documentation
FORGE2 analysis tool |
| The FORGE2 (Functional element Overlap analysis of the Results of Genome Wide Association Study (GWAS) Experiments 2) tool performs a functional overlap analysis to identify tissue- and cell type-specific signal for a given set of GWAS SNPs. |
Overview |
| The FORGE2 tool provides a method to view the tissue specific regulatory component of a set of GWAS SNPs. FORGE2 analysis takes a set of SNPs, such as those hits above genome-wide significance threshold in an GWAS study, and analyses whether there is enrichment for overlap of putative functional elements compared to matched background SNPs. It assesses enrichment on a per cell type basis, since functional elements are differentially active in different cell types, and hence can expose tissue- and cell type-specific signals of enrichment for the given test SNP set. This can reveal the sites of action underlying the GWAS signal, and provide confirmation of the validity of the GWAS where a tissue-specific mechanism is known or expected for the phenotype. Conversely unknown tissue involvements can also be revealed. |
| In this implementation, the functional elements considered are histone mark chromatin immunoprecipitation (ChIP) peaks (Roadmap broadPeak format) from the Roadmap Epigenomics project, DNase I hypersensitive sites (DHSs), and hidden Markov model (HMM) chromatin states. The 5 Histone marks analysed by the tool include H3K4me1, H3K4me3, H3K27me3, H3K36me3 and H3K9me3. Each of these Histone marks is known to be enriched for a specific functional genomic category (H3K4me1-enhancer elements, H3K4me3-gene promoters, H3K27me3-polycomb-repressed regions, H3K36me3-transcribed regions and H3K9me3-repressed regions). |
| For each set of test SNPs, an overlap analysis is performed against the functional elements for each cell sample separately (39 samples for Roadmap), and the number of overlaps is counted. A background distribution of the expected overlap counts for this SNP set is obtained by picking sets of the same number of SNPs as the test SNP set, matched for minor allele frequency (MAF), distance to transcription start site (TSS) and GC content. The matched background sets are then overlapped with the functional elements and the background distribution of overlaps determined. By default 1000 matched sets are used. The enrichment value for the test SNP set is expressed as the -log10 (binomial p-value). Enrichments outside the 99th percentile (by default) of the binomial distribution (after Benjamini-Hochberg multiple testing correction) are considered significant. A schematic of the analysis is shown below. |
| FORGE2 Analysis Strategy |
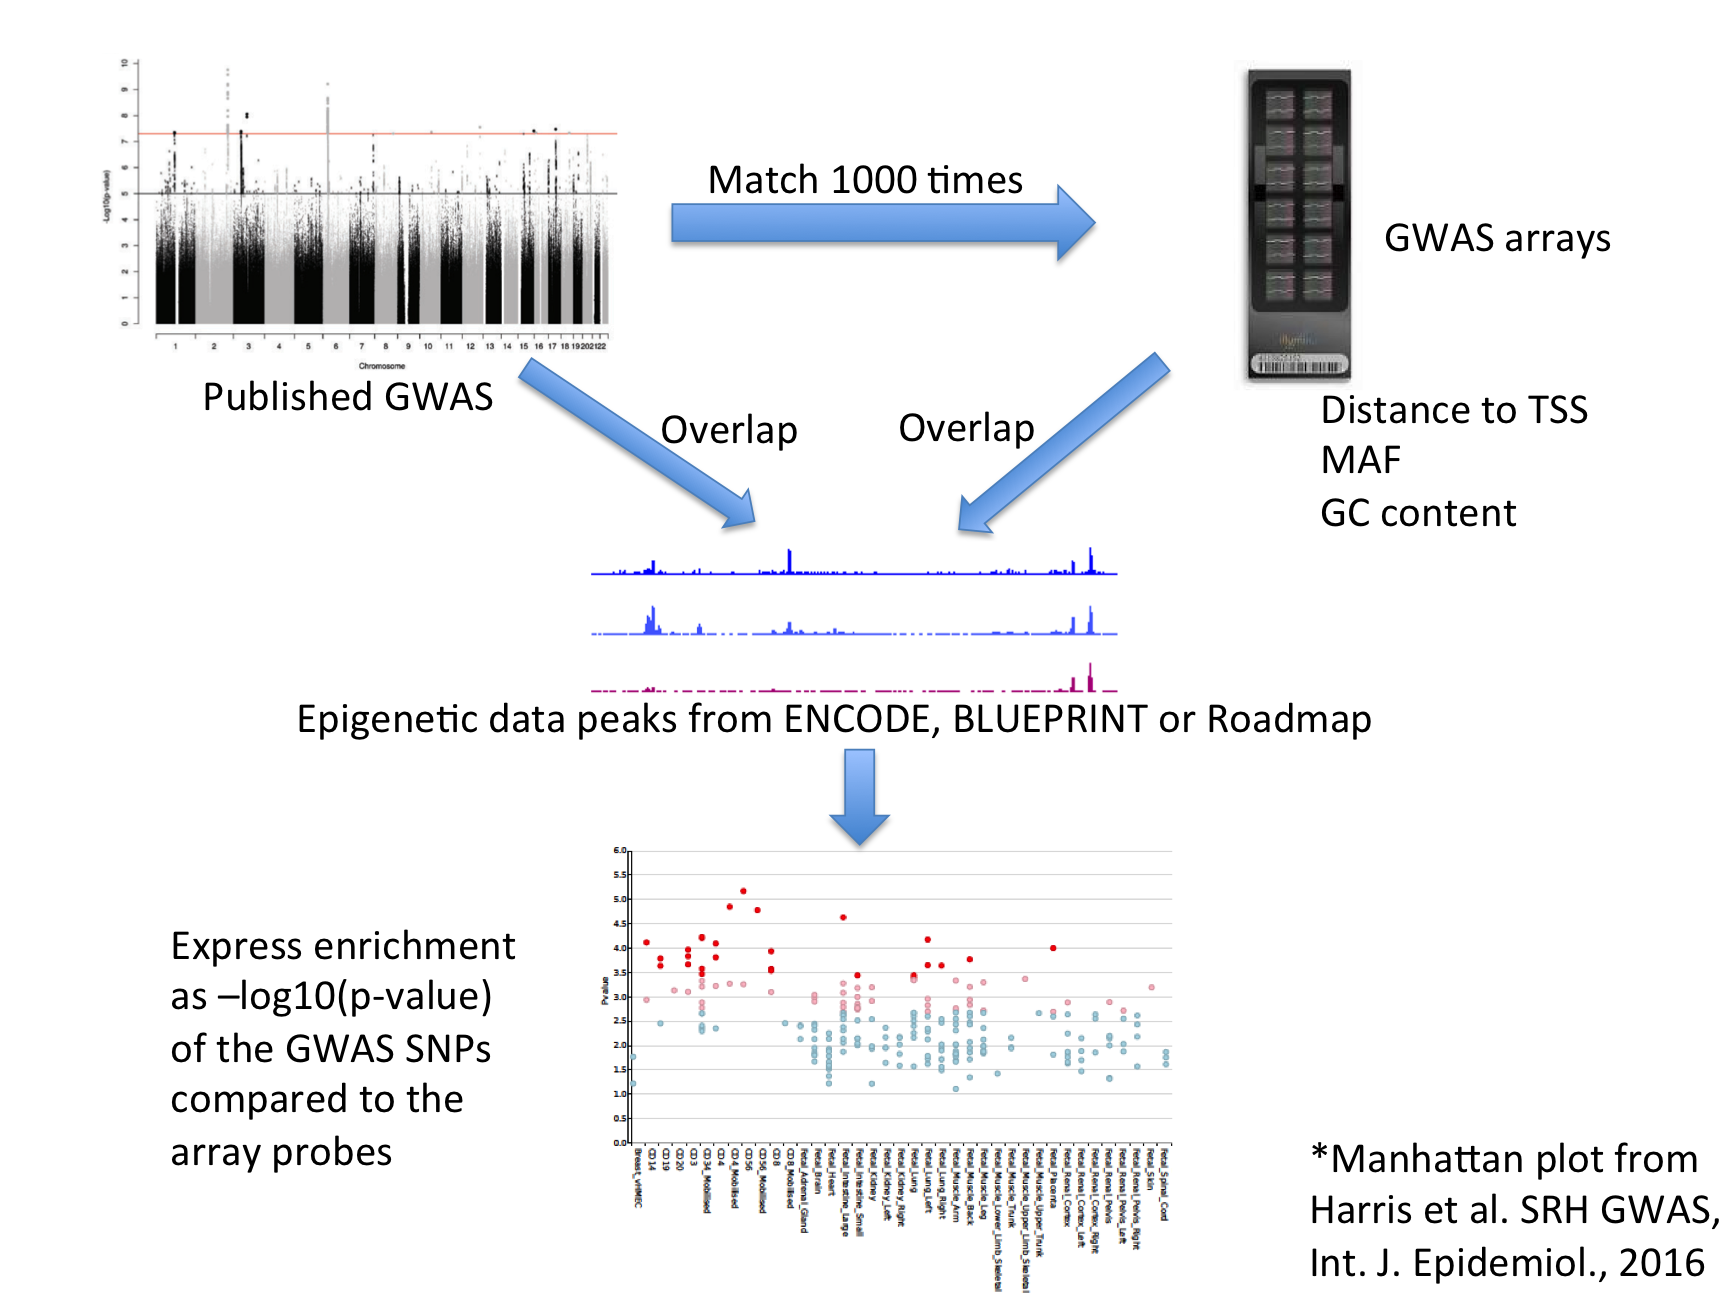 |
| The results are presented by cell sample in either graphic (interactive Dimple chart or static pdf) or tabular (interactive DataTables table or tab separated file) forms. Typical results may show an enrichment of overlap (red or pink points) for the GWAS SNP set in a tissue of mechanistic relevance to the phenotype under analysis, for instance blood cell subtypes for an H3K4me1 analysis on Rheumatoid Arthritis SNPs. |
| Alternatively there may be no enrichment and all points will be blue below the -log10 (binomial p-value) thresholds. This could be because there is no regulatory component underlying the GWAS association, or because the relevant tissue is not present in the available functional element datasets, or for other technical reasons (e.g. too few overlaps). |
| A list of PR interval-associated SNPs from the GWAS catalogue is available as default data in the web tool and the standalone version. |
Methods |
| Data Roadmap Epigenome Histone mark broadPeak files were obtained from here. Roadmap Epigenome DNase I sequencing tag alignments were obtained from here. These were processed by the Hotspot method to give hotspot files using the default parameters. Cell and Tissue assignments were obtained by custom perl scripts using data from ENCODE Data Coordination Center tables or BioSamples. |
| Overlaps Histone mark data in BED format was prepared for overlap analysis using bedops. The location of each SNP was obtained and overlaps with the Histone marks by cell type for every probe were calculated using Bedtools on a local machine. Overlaps were stored as a binary string for each Histone mark data set for each SNP probe in an indexed database, forge2.db. |
| FORGE2 analysis For a given set of SNPs FORGE2 queries the sqlite database and retrieves all overlap bit strings. It then unpacks the bitstrings for each SNP and counts the overlaps per cell type. It next identifies matching probes for the SNPs based on minor allele frequency (MAF), distance to transcription start site (TSS) and GC content, and repeats the overlap analysis for each background set. The final step is a simple calculation of the -log10 (binomial p-value) of the test overlap count versus the background distribution. |
| Outputs The TSV output is generated by FORGE2 during processing. The graphic and tabular outputs are all generated via R code embedded in FORGE2. The pdf output is generated with base R code graphics. The interactive table is produced using the Datatables plug-in for the jQuery Javascript library accessed through the rCharts package. The interactive graphic is a dimple d3 interactive graphic again using the rCharts package. |
| False Positive Rate by SNP set count To test for false positives FORGE2 was run on > 27 million random input SNP tests, showing a low level of false positives (7.6 for every 100,000 tests at a BH-corrected q-value<0.01). Random input SNP sets were analysed at different list sizes including 1000 sets for 5, 10, 15, 20, 30, 40, 50, and 100 SNPs. FDR correction was implemented as in the eFORGE tool. |
Versions |
| v2.0 This version includes support for HMM Chromatin States, histone mark broadPeaks and BLUEPRINT DHS data. Additionally, this version includes improved statistics, with FDR multiple testing correction, depletion analysis and parallel analysis of multiple histone mark broadPeak and HMM Chromatin State datasets. Algorithmic improvements are also implemented, including ameliorated storage of p-values after testing and enhanced structuring of the sqlite database, utilising the SQL framework to facilitate inclusion of additional datasets. |
| v1.1 This version includes LD filtering (default r2 >= 0.8), and -log10 binomial p-value plotting. |
| v1.0 First version of FORGE. |